The program
DNV currently implements energy efficiency programs for over 15 electric and gas utilities in the United States. As the program administrator, we are responsible for items such as: acquiring new end-use customers, conducting engineering reviews to verify project savings/equipment, and processing rebate payments. Each of our programs maintains its own database of project data and energy efficiency measures. Due to the high variation in program database structure and customer data format (billing, third party data, etc), conducting in-depth analysis from multiple data sources has been difficult in the past, requiring extensive manual work to leverage these valuable data for business insight. Within the program we have:
- Synced 200+ unique database tables
- Processed 230,000+ energy efficiency rebate applications
- Tracked 50,000+ energy efficiency measures
Digital interaction
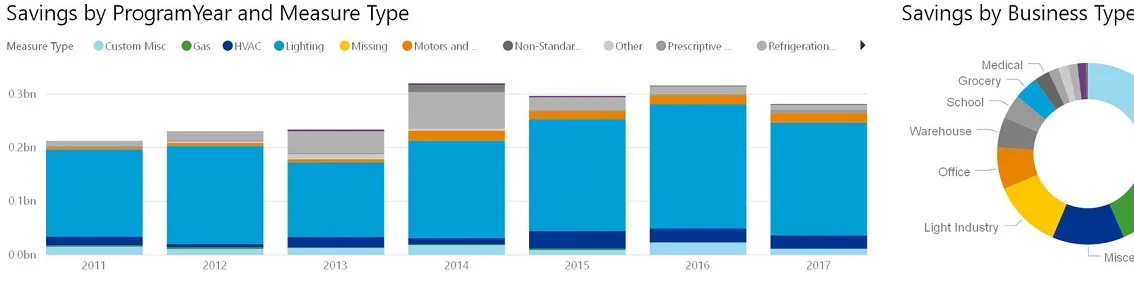
In 2017, building on previous investment projects which created a centralized “Data Cube” for standardized program data, DNV has worked to build a standard schema for customer and billing data as well as a single set of highly visual and fully interactive reports to allow detailed investigation of program trends that require energy use data and/or third party data sources. The reporting platform, “The DSM Dashboard” allows for insight in a variety of new ways that make a transformational change to how utilities can understand their programs. By looking at programs, customers and contractors by measure type, energy consumption, premise density, service industries, company size, and participation history, these new reports allow much deeper understanding of current operations and offer clear direction to support future goals.
Achievements
The reports are built in Microsoft Power BI and hosted for both internal users via the Power BI service as well as for external users on DNV’s Veracity service. As the utility-sponsored energy efficiency (EE) market matures, utilities are continuously looking to increase program operational efficiency and total annual savings, reach a more diverse participant pool, and maintain a broader mix of savings across end-uses and equipment types. The EE Technology “DSM Dashboard” represents a significant step forward in DNV’s commitment to improving program performance and enabling clients and staff to make sound, data-driven decisions related to program design and execution.